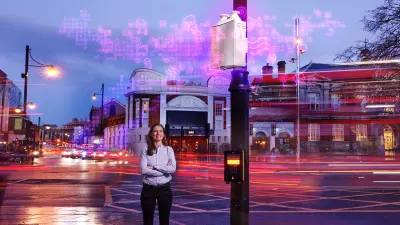
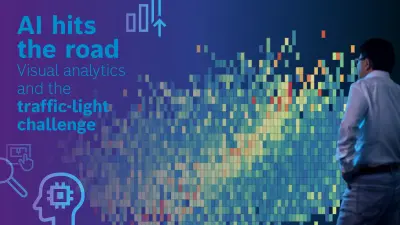
More transparent AI with visual analytics

Liu Ren is chief scientist at the Bosch Research and Technology Center in Silicon Valley. With visual analytics software, he and his team are combining artificial intelligence with human knowledge to bring out the best of both worlds.

Artificial intelligence (AI) provides the tools to mine big data, and self-driving cars would not be possible without it. Wherever it is applied, it helps make people’s jobs and lives easier. But users have to be able to understand and control the way AI works and the grounds for its decisions. To make sure this is so, Dr. Liu Ren is exploring a method called visual analytics. Ren leads a team of Bosch experts at the Bosch Research and Technology Center in Silicon Valley. As chief scientist for intelligent human-machine interaction (HMI) technologies and systems, his job is to explore how human and machine intelligence can be combined. “Machines make mistakes, humans make mistakes. Visual analytics helps both avoid mistakes,” Ren says. In this interview, Liu Ren explains just how it works.
“We want to know what AI doesn’t know, and why. Once we’ve achieved that, we can help it acquire the knowledge it lacks.”
Mr. Ren, what is visual analytics all about?
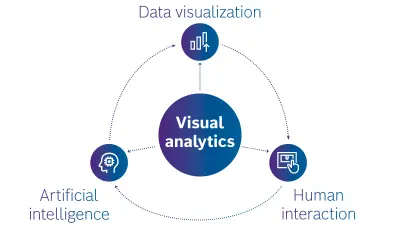
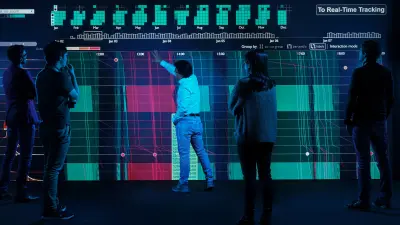
AI-assisted visual analytics, or AiVA for short, is an exploration of an AI’s reasoning. It helps us understand how an AI system arrives at a decision and how this decision-making process can be improved. There are three phases to this. First, data from an AI system is processed so it can be understood by humans. In the next step, the data is visualized. Finally, with a minimum amount of interaction, people can draw on this visualized information to guide and optimize the AI system.
What’s the point of that?
AI algorithms are often like a black box. They churn out a result, but we have no idea how they got there. This can give rise to questions, such as whether decisions are truly unbiased in situations such as automated recruitment processes or credit approvals. Visual analytics can allay these doubts by providing a transparent picture of the decision process. Seeing is understanding!

Can you give us an example?
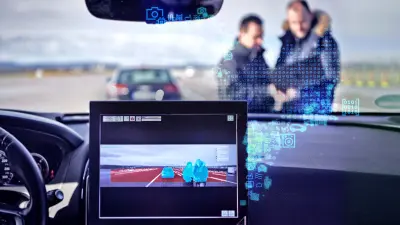
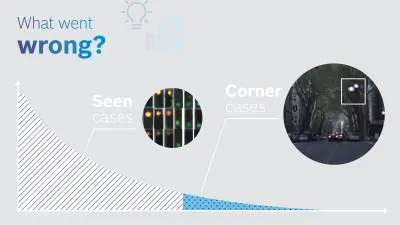
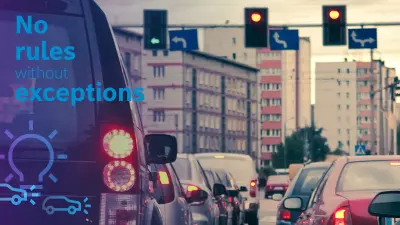
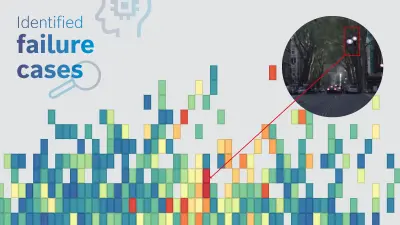
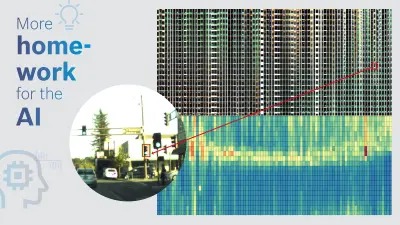
Let’s take the systems we’re working on with the Bosch Functional Testing Team for automated driving. When it comes to image recognition, these cars depend on AI. But they also have to contend with what we call “corner cases.” These are rarely occurring situations where several unusual conditions converge — for example, when a car faces a traffic light at a certain angle in inclement weather. What is needed for the system to distinguish a red light in those conditions? Visual Analytics helps detect blind spots, supplement the data, and increase overall system accuracy.
What happens when it detects one of these shortcomings?
Our visual analytics approach uses a second AI that automatically fills the gaps in the data. The process is transparent and involves human interaction. In this way, the shortcomings of the first AI are remedied.
More than 10
different scenarios will usually be defined for describing a traffic light.
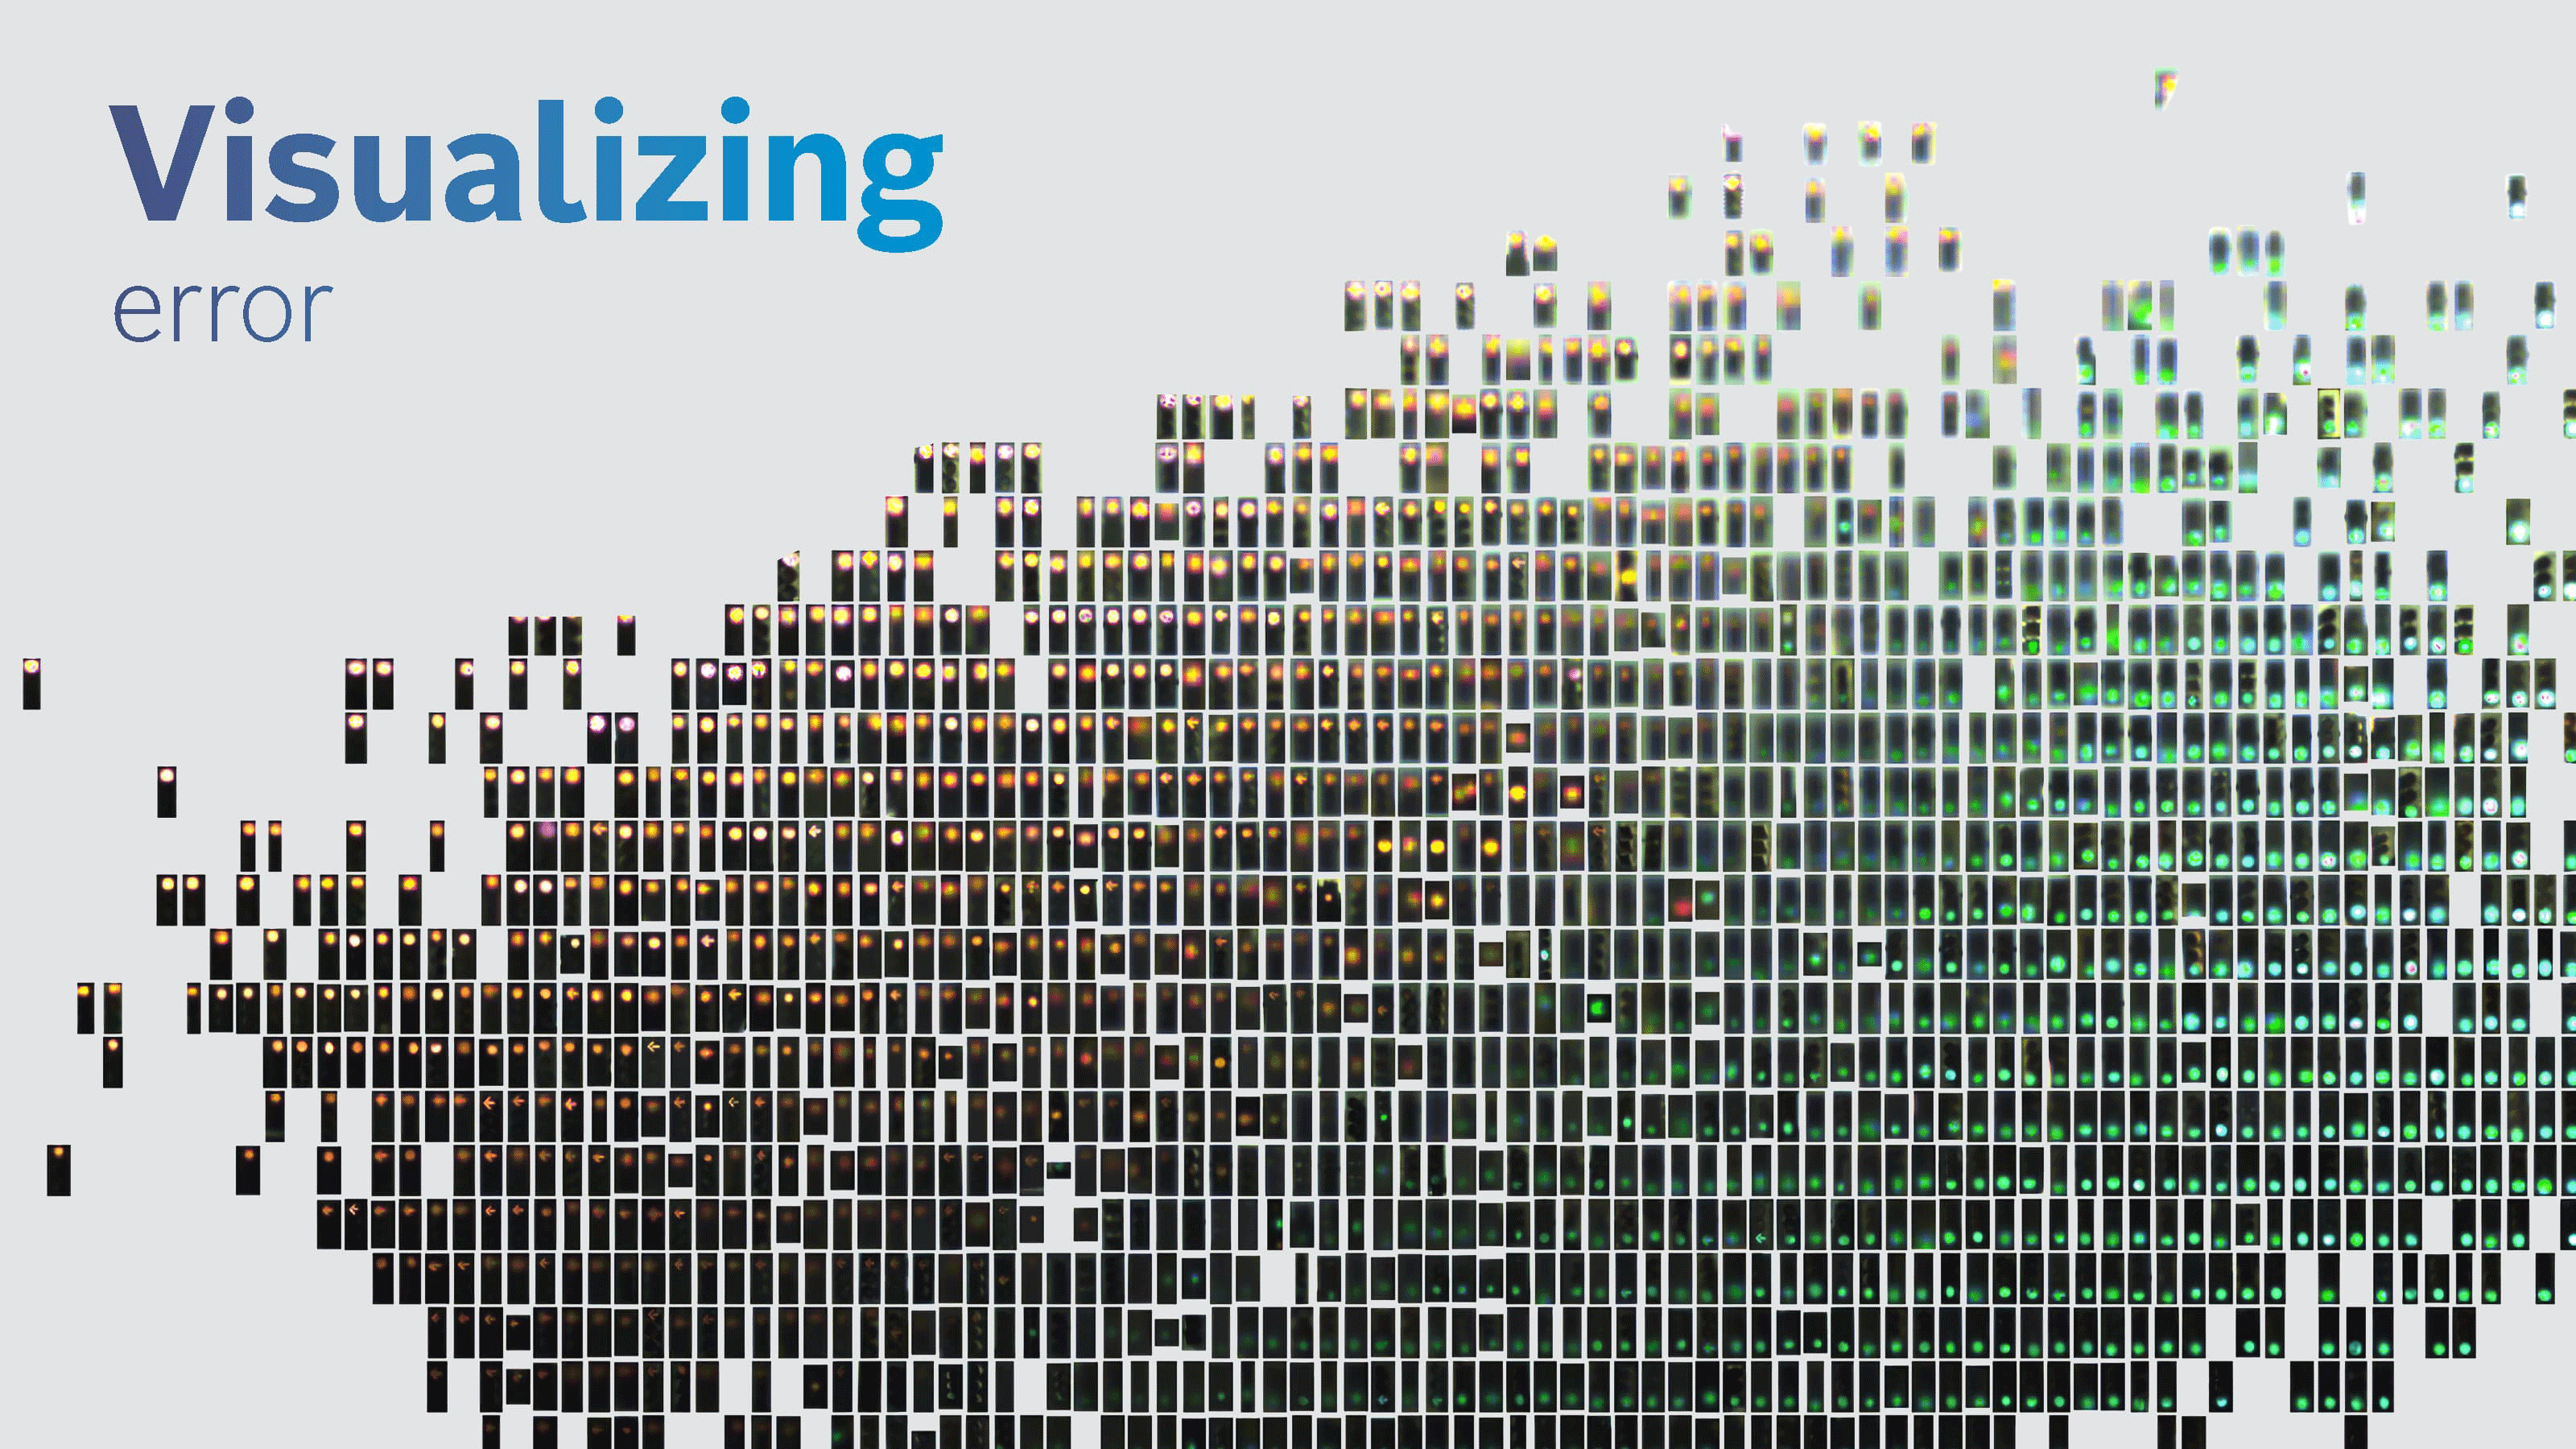
This is how visual analytics spots gaps in an AI’s knowledge
How does the second AI generate this data?
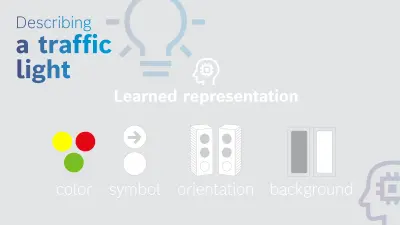
It leverages a method called representation learning. To stay with our traffic-light example: based on the training data, the second AI learns a representation such that each traffic light can be categorized into roughly a dozen cases and their variants, all of which are easy for people to understand. To keep it simple for our example, we’ll stick to just four variants — the traffic light’s color, the symbol in the signal light, the background, and the direction it’s pointing. These four representative categories can serve to describe every traffic light. That’s how the second AI categorizes training data, recognizes and classifies error cases associated with the traffic light detector, the first AI. In the event of a corner case, the second AI can also effectively generate new training data to further improve the performance of our traffic light recognizer, based on the four categories and human input.


Where do people come in to this?
The way the data is visualized allows people to spot errors immediately. People can easily analyze these cases by associating them with the learned representations, and pinpoint the gaps in the training data for the AI. In a second step, the system either generates new data or offers guidance on how to collect real data to fill these gaps. This way, people and machine work together to increase the performance of our AI system.
“In the industrial AI field, Bosch is a force to be reckoned with — the awards we have won show that.”
Where else does Bosch use visual analytics?
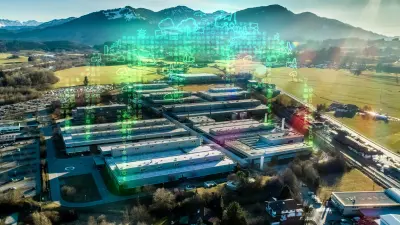
A recently developed algorithm called Tensor Partition Flow, or TPFlow for short, allows retailers to analyze customer traffic data. And urban traffic flows can be examined better, allowing ride-sharing services to be dispatched properly and make the most of the capacity available. TPFlow won the best paper award at the 2018 IEEE VISUALIZATION conference, the leading conference on big data and visual analytics. We have also won an award for a solution that spots bottlenecks on Industry 4.0 production lines. Here, we are working closely with the Bosch Center for Artificial Intelligence to make a large-scale rollout possible.
What will future visual analytics applications be able to do?
Their objective will still be to make sense of the black box that is AI. Without this understanding, people will not develop trust in AI – trust that will be a crucial quality feature in tomorrow’s connected world. That’s why we at Bosch want to develop safe, robust, and explainable AI products. I firmly believe the visual analytics approach that keeps people in the loop will continue to play a key role here.
Profile

Liu Ren
Chief scientist for HMI at the Bosch Research and Technology Center
Demand for transparent and understandable AI is on the rise. Algorithms have to be explainable.
Dr. Liu Ren is VP and Chief Scientist for Intelligent HMI Technologies and Systems at the Bosch Research and Technology Center in Silicon Valley. He is also the global head overseeing AI research for human machine collaboration program with research teams located in Silicon Valley and Pittsburgh in the United States and Renningen in Germany. Liu received his PhD and MSc degrees in computer science at Carnegie Mellon University. He also has a BSc degree in computer science from Zhejiang University in Hangzhou, China.